Is it Getting Hot in Here?

Global Changes in Extreme Weather


Global
Global icon
Cities
Global icon
Humans
Global icon


In recent years, we have grown used to climate records being broken on a regular basis. While this may seem unimportant at first, it is, in fact, largely attributable to climate change.

As the drivers of climate change go unperturbed, the prevalence of climate records and extreme weather events is expected to increase.

Through this data story, we draw upon changes in extreme weather and their impact on society at three levels of analysis: the global level, the city level, and the human level.

Climate change could be irreversible by 2030

"The last seven years have been the warmest seven years on record.“

- Gavin Schmidt, Director of the Goddard Institute for Space Studies.

Global Temperature Anomaly

Global temperatures have been on a steady increase. The below animation captures these shifts from 1850 to 2020.
According to NOAA's   2020 Annual Climate Report the combined land and ocean temperature has increased at an average rate of 0.13 °F (0.08 °C) per decade since 1880.

However, the average rate of increase since 1981 (0.18 °C / 0.32 °F) has been more than twice that rate.

The Intergovernmental Panel on Climate Change stated in their 2021 Climate Report that temperature increases of 1.5-2 °C will occur unless "massive and immediate cuts in greenhouse gas emissions are made", along with other adverse consequences.

How have increased emissions impacted global temperatures?

Temperature increases are largely attributable to greenhouse gas emissions, in particular CO2 emissions.

Just five countries — including the United States — create more than 50% of the global CO2 emissions.

2020 CO2 Emissions by Country

Emission trajectories over time are highlighted below, outlining the largest global contributors.
In "An Environmental History of the 20th World", environmental historian J. R. McNeill remarks that during the late 19th century through to the end of the 20th century, the world economy grew 14-fold, world population quadrupled, and energy consumption increased five-fold. These stark changes were brought about by the invention of artificial fertilizer, medicines and vaccines, as well as industrialization which massively improved human productivity. However, these changes also resulted in an exponential increase in carbon dioxide, as well as other emissions.

Some countries are responsible for more emissions than others, either historically or in the current day. Because of this, and because the atmosphere is a "public good" (everyone shares this resource since everyone breathes!), deciding how to deal with emissions is complicated. On the one hand, countries likely do not want other countries polluting their air, but at the same time, would prefer not to invest in reducing their own emissions if it dampens their economic outlook. Also, some countries may feel entitled to pollute, claiming it is a necessary stage in industrial development until a certain level of GDP is reached. No matter what view is held, one thing is at least clear to everyone: emissions are increasing.


Extreme weather events – particularly heatwaves and droughts – have become more frequent since 1950 and will become more frequent and severe as global temperatures increase.

What are the types of extreme weather events occurring globally?

Extreme Weather Events: Global Explorer

Extreme weather events are becoming more and more frequent across the world. The below visual allows users to explore the time period as well as event type.
The globe shows   252 extreme weather events across the world for which scientists have carried out attribution studies.
Of these events,  92%  were within the past decade.
Event Type
Number of Events
252
Weather Events
The different symbols show the type of extreme weather event.
What are the Challenges facing Cities?

Cities are major contributors to climate change. According to UN Habitat, cities consume 78% of the world’s energy and produce more than 60% of greenhouse gas emissions. Yet, they account for less than 2% of the Earth’s surface.

Cooling Degree Day Increases across major cities:

One of the biggest challenge cities will face is providing cooling in a warming climate. The concept of Cooling Degree Days (CDD), shown below for different cities, is primarily used to estimate the amount of active cooling needed to maintain a comfortable indoor temperature. Degree days represent the number of degrees the daily average temperature is above 65°F. Below we use climate projections for 2050 and 2080 to generate predictions on how much CDDs will increase. We see that in warmer climates, the impact will be much larger than in moderate climates

How will we navigate the cooling challenge?

Cooling Exposure: City Matrix

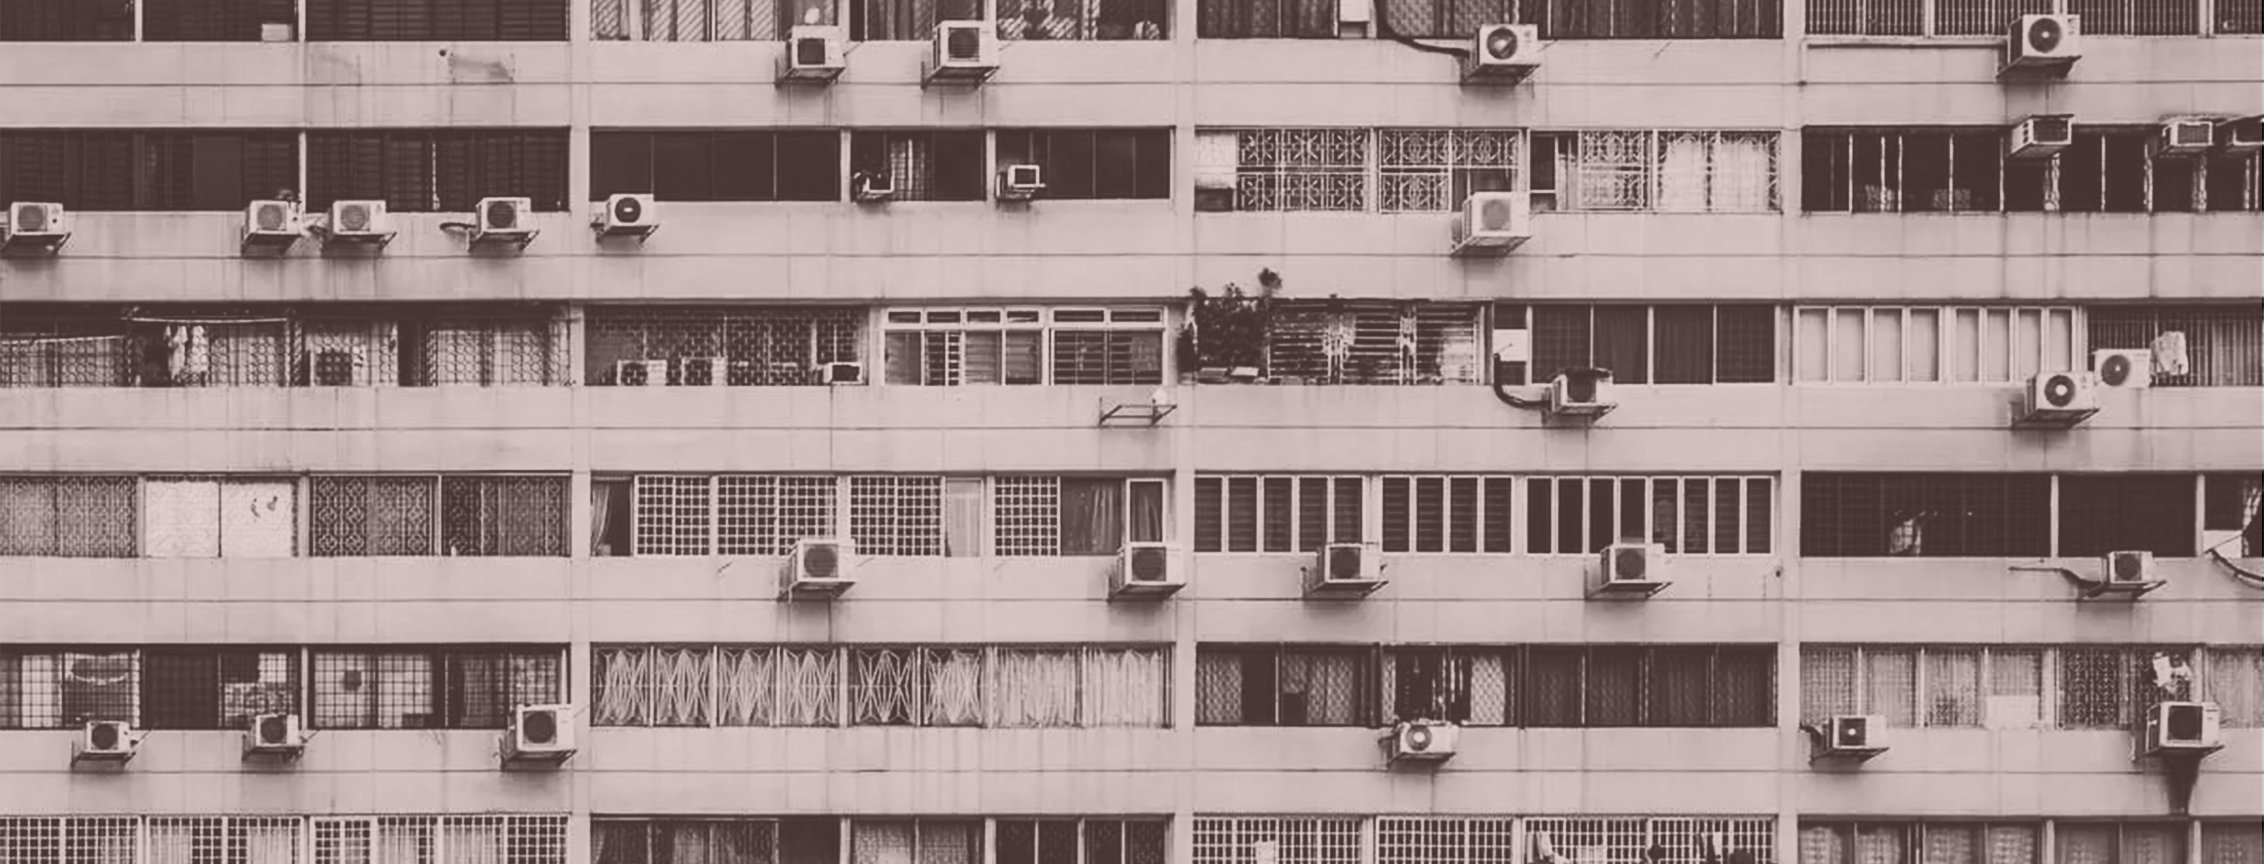
Worldwide power consumption for air conditioning alone is forecast to surge 33x by 2100 as developing world incomes rise and urbanisation advances. But will cooling adoption be experienced evenly across the world? Below we introduce Cooling Degree Day exposure which factors in city populations to reflect the magnitude of challenge that cities will face. We also reflect on Country Income level and Climate type to set the stage for what is a more realistic outlook on the factors contributing to the cooling challenge.

imgNY
imgCH

Chicago,US

Total CDD Exposure(in billions): 0.5

Country Income Classification: High

Current Households with ACs (country-wide): 90%

Climate Classification: Humid continental

imgNY

New York,US

Total CDD Exposure(in billions): 2.0

Country Income Classification: High

Current Households with ACs (country-wide): 90%

Climate Classification: Humid subtropical

imgSF

San Francisco,US

Total CDD Exposure(in billions): 0.3

Country Income Classification: High

Current Households with ACs (country-wide): 90%

Climate Classification: Mediterranean

imgSF

Tokyo,Japan

Total CDD Exposure(in billions): 39.5

Country Income Classification: High middle

Current Households with ACs (country-wide): 89%

Climate Classification: Temperate

imgSF

Jakarta,Indonesia

Total CDD Exposure(in billions): 74.6

Country Income Classification: Lower middle

Current Households with ACs (country-wide): 7%

Climate Classification: Tropical rainforest

imgSF

Mumbai,India

Total CDD Exposure(in billions): 74.6

Country Income Classification: Lower middle

Current Households with ACs (country-wide): 7%

Climate Classification: Tropical Savanna

img

Bangkok,Thailand

Total CDD Exposure(in billions): 37

Country Income Classification: Upper middle

Current Households with ACs (country-wide): 72%

Climate Classification: Tropical Savanna

imgSF

Lagos,Nigeria

Total CDD Exposure(in billions):42.3

Country Income Classification: Lower middle

Current Households with ACs (country-wide): 5%

Climate Classification: Tropical Savannah

imgSF

Karachi,Pakistan

Total CDD Exposure(in billions): 51.6

Country Income Classification: Lower Middle

Current Households with ACs (country-wide): 6%

Climate Classification: Tropical/Temperate

What Impacts will increasesing temperatures have on humans?

The growing number of people in cities and an increasing elderly population have increased heat-related deaths, according to a 2018 study in The Lancet

Heat Related Deaths and Access to Electricity

As the cooling challenge story unfolds, we look to investigate two key questions across global regions: How many people do not have access to electricity (which would be used for cooling) and the number of heat related deaths. The below icons are double coded to provide insight into this. The number of deaths is representative of the 2000-2019 time period, while the access to electricity only looks at data from 2019. Can a correlation be made?

Americas
Europe
Africa
Asia
Oceania
Global

Global

489,075    
(11%)

Global
489,075      
(11%)

Global
489,075      
(11%)

Global
489,075      
(11%)
Global
489,075      
(11%)

Global
489,075      
(11%)

What Should be Done?

There is no singular solution to navigating the next wave of challenges. But a focus on proven and tested intervention strategies is imperative. To alleviate the many climatic challenges, cities must design with mitigation and adaptation in mind. Below are a few recommendations that tackle different intervention categories.


Our Team